[tab_nav type=”two-up”][tab_nav_item title=”The Case” active=”true”][tab_nav_item title=”Answer” active=””][/tab_nav][tabs][tab active=”true”]
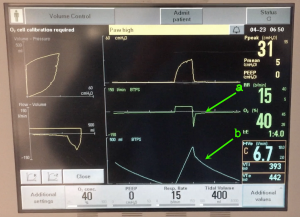
A 50 y/o female with a history of asthma is intubated in the ED for SOB. The patient is hemodynamically stable and has a SpO2 of 100%. You just got your cup of Starbucks and don’t want to put it down, so you look at the vent from the door and notice this. What’s the patient’s problem and what else should you look for?
[/tab]
[tab]
This patient has severe obstruction looking at her vent waveforms from severe bronchospasm. Her vent is set to deliver a constant flow (hence the square looking inspiratory volume curve) but the expiratory limb looks off…. Compare our patient’s flow curves to the following video of relatively normal flow curves.
In the image below, you will notice our patient’s expiratory limb moves toward the “baseline” rapidly, but takes a while to get to zero (as opposed to a normal curve that has a soft exponential return). You can also see how long it takes the patient to expire by looking at her flow curve (b). The flow-volume loops (left) also show significant obstructive pattern.
After checking an end-expiratory hold, the patient had about 10 cm H2O of autoPEEP – which was expected given her degree of obstruction.
For more on mechanical ventilation waveform analysis, check out these links:
- http://marylandccproject.org/core-content/sanjay-desai-whats-diagnosis-ventilator-waveform-analysis/
- http://marylandccproject.org/core-content/ventilator-waveform-analysis/
- http://lifeinthefastlane.com/ccc/flow-volume-loops/
- http://lifeinthefastlane.com/ccc/pressure-vs-volume-loop/
Your Content [/tab][/tabs]
[author title=”About the Author”]


